Smart Local Governance: From business question to insight
Laure Spruyt
How do you turn existing data into concrete actions that make a city cleaner and more pleasant? We took on that challenge together with the City of Turnhout. What began as an analysis of reports regarding litter and illegal dumping evolved into a complete end-to-end data project: from business requirements and data integration to data modeling, dashboards, and automated notifications. At the same time, this project served as the ideal learning path for onboarding a new colleague and a student intern. The result? In just six weeks, a practical case study with tangible added value for a smart, data-driven local government.
A data-driven approach to a cleaner Turnhout
As part of the City of Turnhout’s long-term plan, the city is strongly committed to improving cleanliness, with the goal of creating a more pleasant and livable city for residents and visitors. The city already has a reporting system that tracks reports of litter and illegal dumping, which serves as the basis for the current collection and response system. To make better use of this existing data and apply it more effectively, the information surrounding these reports was further analyzed to detect patterns and translate insights into more efficient planning and follow-up. This approach makes it possible to intervene more proactively, leading to a more sustainable improvement in cleanliness. This process coincided with my six-week onboarding and Ellen’s internship.
From business questions to actionable insights
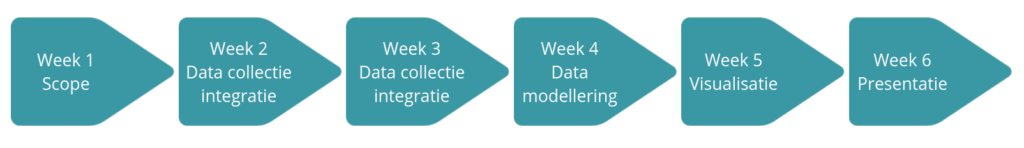
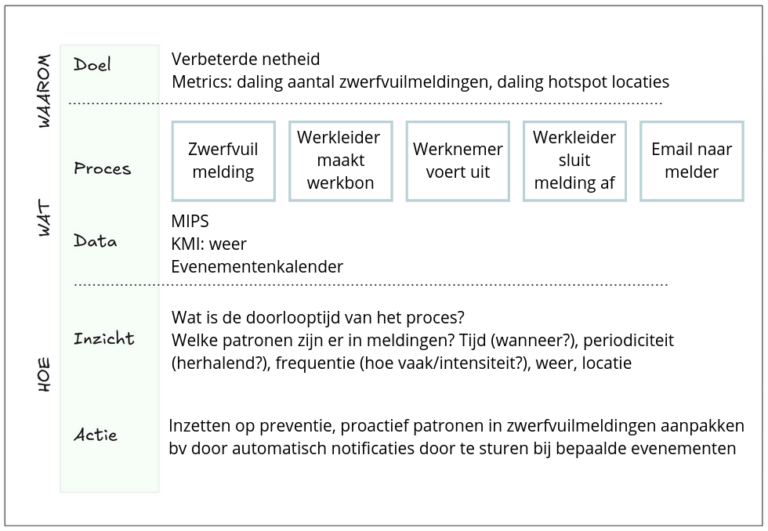
We quickly walked through the process that Understanding Data uses to help SMEs become data-driven. We started with the basics: clear business questions and customer interviews. Based on that input, we defined clear objectives, mapped out processes and underlying data, and translated this into concrete, actionable insights and steps.
Data integration as a solid foundation
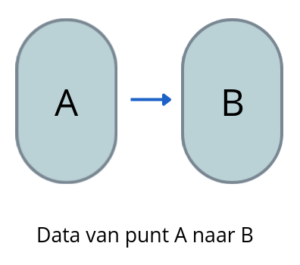
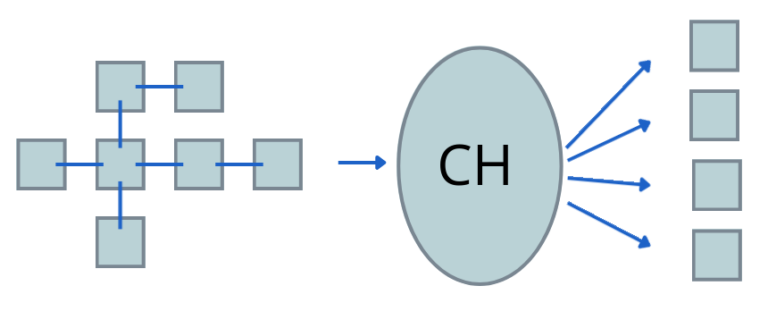
Next, we got to work on data integration. Using dlt (data load tool), we ensured that data flowed efficiently from point A to point B. Since access to real data was limited, we simulated the data collection process using realistic test data. This allowed us to continue building and test the approach in a representative manner.
Building a data warehouse for reliable analyses
In the next step, data modeling, we used dbt (Data Build Tool) to structure the data analytically. Data from software is often very difficult to interpret. The purpose of a data warehouse is to model data in a business-friendly format. We worked with staging, data tests, facts, dimensions, and marts to make the data more interpretable and usable. This is a crucial step: without a solid data model, analyses often remain superficial, inconsistent, or difficult to scale. By logically structuring and validating data, you create a single reliable source of truth. This not only makes it easier to generate insights but also ensures that different teams work with the same definitions and figures.
Dashboards and automated notifications
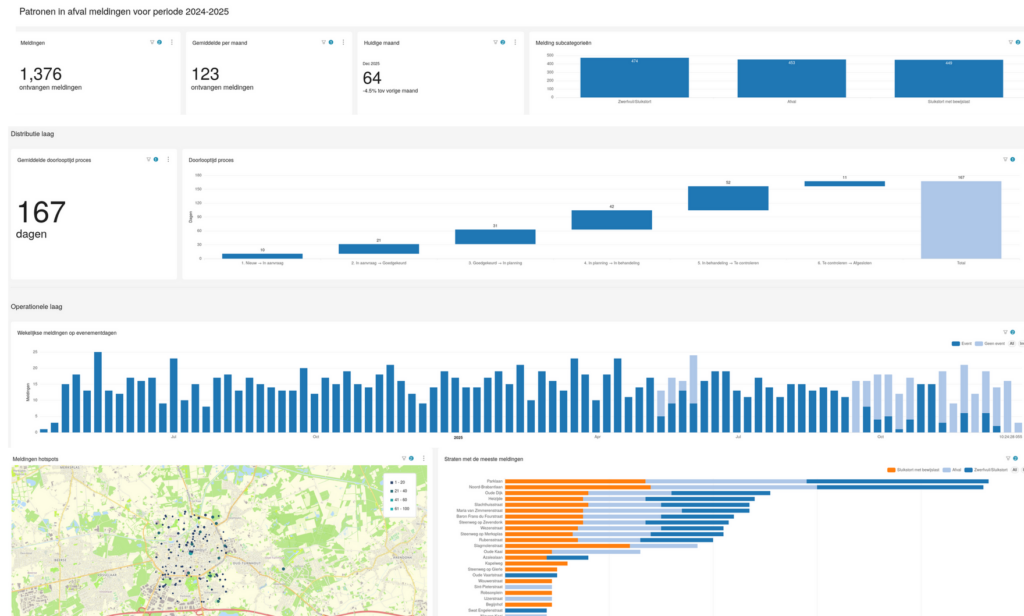
Finally, we built the consumer layer: dashboards and visualizations in Superset. This allows us to make insights accessible to different levels within the organization. While the policy layer requires a strategic overview, the operational layer focuses on specific patterns, such as litter reports, to take targeted action. In addition, we implemented automatic notifications in Keep. For example, every Monday an overview of scheduled events can be shared with the operational teams, allowing them to proactively adjust their schedules to accommodate additional waste collection.
An end-to-end data project in six weeks
We concluded the project with a presentation to the City of Turnhout. In just six weeks, the team managed to onboard a new colleague, successfully complete an internship, and deliver an end-to-end data project. Thank you to the City of Turnhout for the great collaboration!
Interested in taking steps toward a smart, data-driven local government?
Let's Create Your Strategic Roadmap
Do you want to make better use of your data and information? Contact us now, and learn how we can bring your organisation to the next level.